Montana Power Outage Season
When outages happen most in Montana, and what to expect.
July is historically Montana's busiest month for recorded power outages, part of a summer season (June–August) that accounts for about 34% of all recorded outages statewide, averaging 3.4 hours per event. 1 of Montana's 50 tracked counties currently carry a Reliability Grade of F.

Your support helps keep this site running at zero extra cost to you! As an Amazon Associate, we earn from qualifying purchases.
Montana outages by month
Total recorded events and average duration per event, summed across every tracked county in Montana.
Peak season insight
Montana's outage season runs June–August, accounting for 34% of all recorded outages. July has the highest frequency.
Month-by-month data table
| Month | Events | Avg duration |
|---|---|---|
| January | 661 | 3.4 hrs |
| February | 501 | 2.8 hrs |
| March | 498 | 3.5 hrs |
| April | 671 | 3.3 hrs |
| May | 856 | 3.3 hrs |
| June | 1,012 | 3.2 hrs |
| July | 1,128 | 3.7 hrs |
| August | 1,000 | 3.1 hrs |
| September | 778 | 2.9 hrs |
| October | 731 | 3.3 hrs |
| November | 671 | 3.3 hrs |
| December | 730 | 5.1 hrs |
This month in Montana
October has historically recorded 731 outage events across Montana, below the state's typical monthly average. Outages that start in October have averaged 3.3 hours.
Main causes by season
Named storms behind Montana's worst recorded outages, from the NOAA Storm Events Database.
Winter (December–February)
- High Wind
- Winter Storm
- Heavy Snow
- Strong Wind
- Winter Weather
Spring (March–May)
- Winter Storm
- Flood
- Drought
- High Wind
- Heavy Snow
Summer (June–August)
- Wildfire
- Drought
- Flash Flood
- Thunderstorm Wind
- Heavy Snow
Fall (September–November)
- High Wind
- Heavy Snow
- Drought
- Thunderstorm Wind
- Wildfire
Montana's worst outage events on record
The five largest outages in Montana by duration and customers affected.
| Date | Duration | Customers affected | Cause |
|---|---|---|---|
| Jul 25, 2024 | 121 hrs | 55,225 (95%) | Excessive Heat |
| Dec 17, 2025 | 111 hrs | 23,250 (35%) | Strong Wind |
| May 31, 2020 | 62 hrs | 34,234 (51%) | Thunderstorm Wind |
| Nov 23, 2024 | 87 hrs | 16,911 (25%) | Winter Storm |
| May 8, 2024 | 118 hrs | 10,468 (26%) | Heavy Snow |
Highest-risk counties in Montana
Lowest reliability percentile among Montana's tracked counties.
| County | Grade | National percentile |
|---|---|---|
| Lincoln County | F | 14th |
| Sanders County | D | 20th |
| Madison County | D | 31st |
| Granite County | D | 33rd |
| Flathead County | D | 35th |
Live weather alerts for Montana
Special Weather Statement
Special Weather Statement issued October 1 at 6:29AM MDT by NWS Great Falls MT
Read the official NWS alert →These live alerts come from the National Weather Service. They are public-safety information, not an outage prediction.
Montana power outage FAQ
When do power outages happen most in Montana?
July is historically the busiest single month for recorded outages in Montana, and Summer (June–August) accounts for about 34% of all recorded outages across the state.
How long do power outages in Montana typically last?
Across Montana's tracked counties, the average recorded outage lasts about 3.4 hours, though individual events -- especially named storms -- can run much longer.
Which counties in Montana have the highest outage risk?
Lincoln County, Sanders County, Madison County, Granite County, Flathead County currently rank lowest for reliability in Montana. See each county's page for its full history.
Does this page predict a power outage in Montana?
No. It describes patterns in recorded county-level outage history, not a guaranteed future event. Check the live National Weather Service alerts below for current conditions.
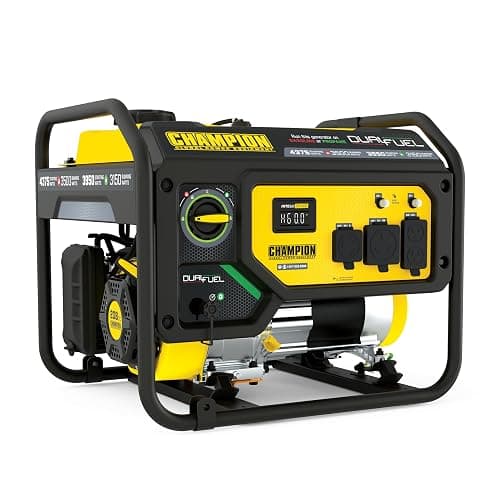
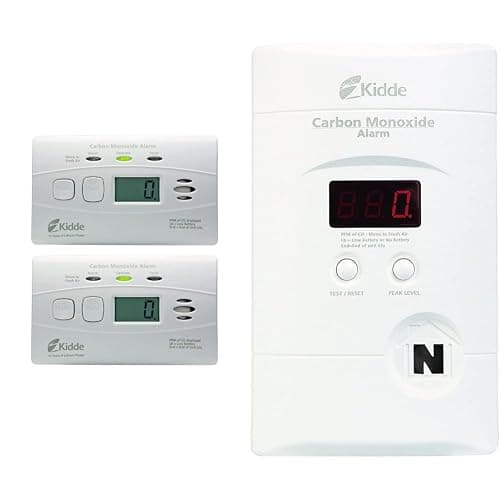
Prepare for Montana's outage season
Sized for Montana's recorded outage frequency and duration.