Fluvanna County Power Outage History
2015–2025 · Virginia
Bottom 20% least reliable nationally — frequent and/or long outages. How grades are calculated
Outages by year
Outages by month (seasonality)
Worst outage events on record
| Date | Duration | Customers affected | Cause |
|---|---|---|---|
| Dec 16, 2020 | 29 hrs | 5,866 (40%) | Winter Weather |
| Jan 3, 2022 | 196 hrs | 5,734 (40%) | Winter Storm |
| May 4, 2021 | 29 hrs | 5,260 (36%) | Thunderstorm Wind |
| Jun 15, 2017 | 2 hrs | 5,142 (36%) | Unnamed event |
| May 3, 2025 | 3 hrs | 4,715 (33%) | Unnamed event |
Over the 11 years from 2015 to 2025, Fluvanna County recorded 714 distinct power outage events, averaging 3.6 hours per event.
The single worst outage on record in Fluvanna County started December 16, 2020 (Winter Weather), lasting 29 hours and leaving up to 5,866 customers without power (40% of the county) at its peak.
July has historically been the worst month for outages in Fluvanna County, with 98 events recorded during that month across the dataset.
Based on this history, Fluvanna County earns a Reliability Grade of F, placing it in the 20th percentile nationally for grid reliability (higher percentile = more reliable).
Sized for Fluvanna County's outage profile
See more picks in our Best Dual-Fuel Portable Generators for Power Outages roundup.
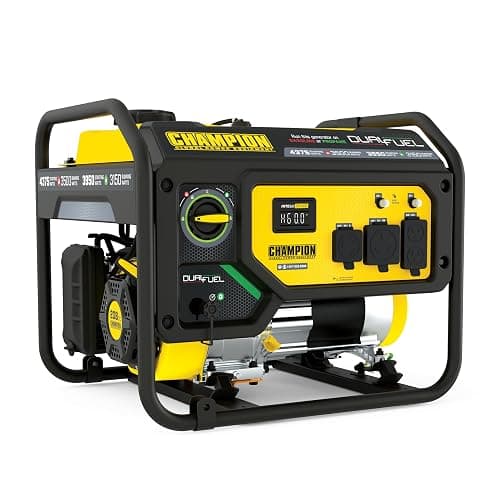
Champion Power Equipment 4375-Watt Dual Fuel RV Ready Portable Generator with Free 3-Year Warranty
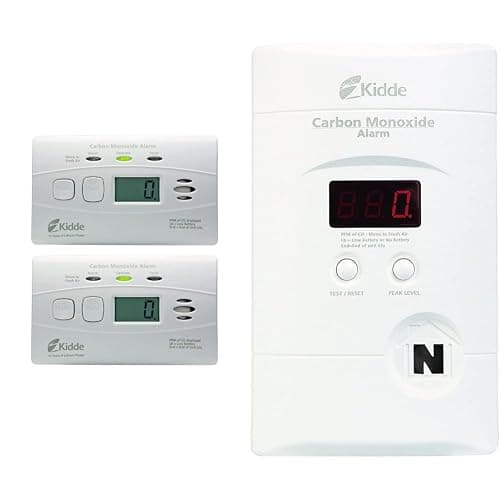
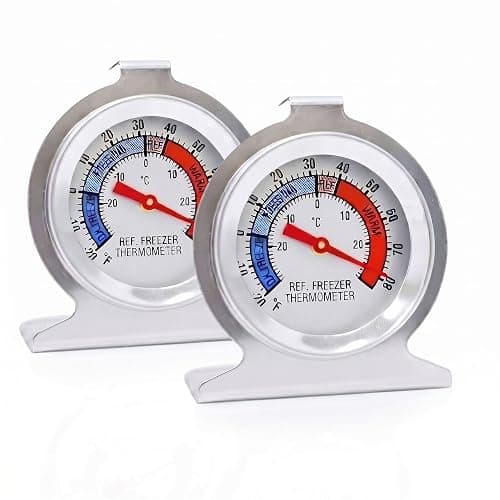
Outage-prep kit
See our outage-prep guides.

Similar counties in Virginia
Counties with the closest reliability grade and national percentile to Fluvanna County.
| County | Grade | National percentile |
|---|---|---|
| Henry County | F | 19th |
| Halifax County | D | 21st |
| Albemarle County | D | 21st |
| Botetourt County | F | 18th |
| Rappahannock County | F | 18th |
FAQ
How often does power go out in Fluvanna County?
Between 2015 and 2025, Fluvanna County recorded 714 outage events, averaging 3.6 hours each.
What is Fluvanna County's reliability grade?
Fluvanna County has a Reliability Grade of F, in the 20th national percentile.
What was the worst power outage in Fluvanna County?
The worst outage on record started December 16, 2020 (Winter Weather), lasting 29 hours and affecting up to 5,866 customers.